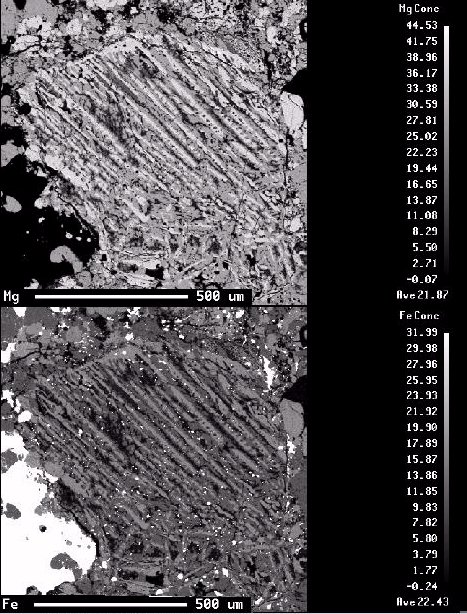
These images are digital X-ray maps of Mg (top) and Fe (bottom). They
are generated by scanning the sample back and forth under an electron beam and
recording the intensity of the x-rays generated at each point. In these images,
the brighter the pixel the higher the concentration of the element. For these
maps the data is further processed by comparing the X-ray intensity at each
pixel to the intensity of a standard sample. In this way we can produce a
composition map where the brightness of each pixel is related to an approximate
composition (In this case weight percent MgO and FeO).
The important features of these images are the striped nature f the chondrule. This is produced by alternating crystals of olivine and pyroxene (Hypersthene). The dark material between these crystals is a Ca-rich glassy material. Also important is the large grain of native iron (white particle in lower left corner of the Fe image)
 Return to the Pictures Menu