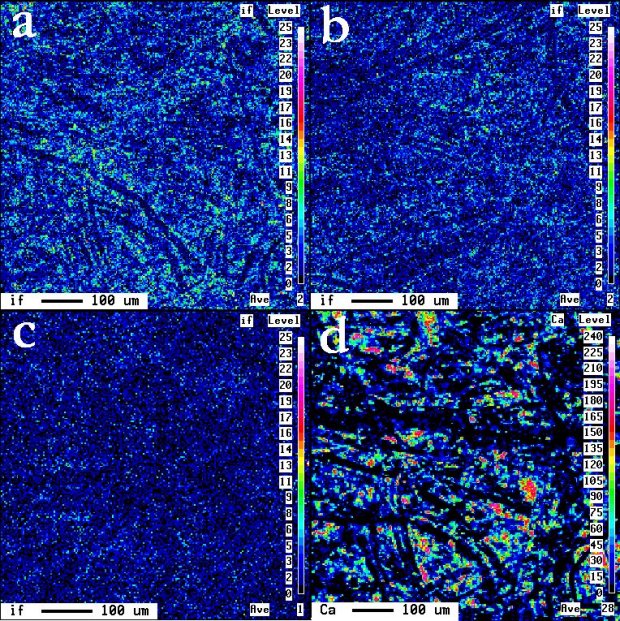
Figure 7
Iodine maps of the same paper subjected to
different treatments. a) starch + polymer treated, b) starch
treated, c) untreated, d) Ca map of same area as a)..
![]()
Figure 7
shows the results of iodine (= starch) mapping for untreated,
starch treated and starch-polymer treated samples of the same
paper. It is immediately obvious that starch coverage is lowest
on the untreated paper and highest on the starch plus polymer
treated paper. The addition of the polymer to the starch mixture
increases its wetting capability, allowing it to cover more of
the surface. In terms of print quality, (wicking, feathering,
print through and show through) these papers rank in the same
order, the untreated base sheet having unacceptable print quality
and the starch + polymer treated sheet having the highest print
quality. This indicates that with all factors equal, simply increasing
the starch coverage improves print quality. It is also interesting
to note that the distribution of starch parallels the distribution
of pcc (Figure 7d). This is contrary to conventional thinking
which would suggest that starch would not be associated
with pcc due to the low surface energy of pcc.
Figure 7
Iodine maps of the same paper subjected to
different treatments. a) starch + polymer treated, b) starch
treated, c) untreated, d) Ca map of same area as a)..
![]()