Due to the composition of starch
it produces few X-rays, which in this case would be indistinguishable
from X-rays generated by the cellulose fibres below it. In order
to determine the distribution of starch it must be selectively
tagged with a heavier element ( in this case iodine). The results
of mapping for iodine will parallel the distribution of starch.
Unfortunately, life is rarely so simple. As seen in Figure
2, the I L peak is on the flank of the Ca K1,3
peak. The presence of CaCO3 (pcc) in most
ink jet papers indicates a potential problem. Figure 4
shows the results of mapping for iodine and pcc on a starch treated
ink jet paper (sample C9). It is immediately obvious that the
two maps are very similar, the difference being the lower intensity
of the iodine map. Due to the position of the iodine peak on the
flanks of the Ca peak, the iodine signal is swamped by the Ca
contribution to background. In order to determine the actual distribution
of the iodine this background must be removed. The simplest way
to do this is to measure background on either side of the iodine
peak, interpolate the background under the iodine peak and subtract
it. Figure 5 shows the results of this operation. For comparison
Figure 6 shows the same operation carried out on a blank
paper (i.e. not iodine treated). Although there is still some
signal, it is mostly random, and does not reflect the Ca distribution.
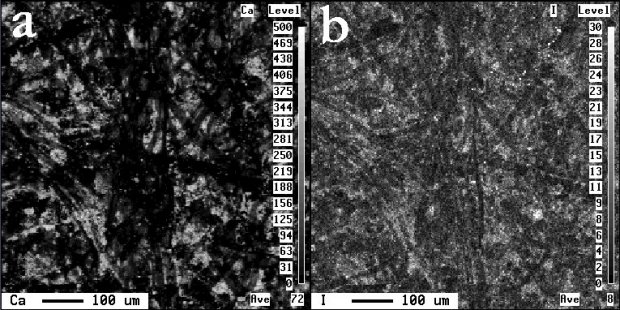
Figure 4 Maps of Ca (a) and I before background subtraction (b) for the same area (sample C9). Note the similarity in distribution.
Figure 5 Background subtraction
process for an iodine map (sample C9). a) Raw image. b) and c)
upper and lower background image respectively. d) background subtracted
image ( raw - (upper bg + lower bg)).
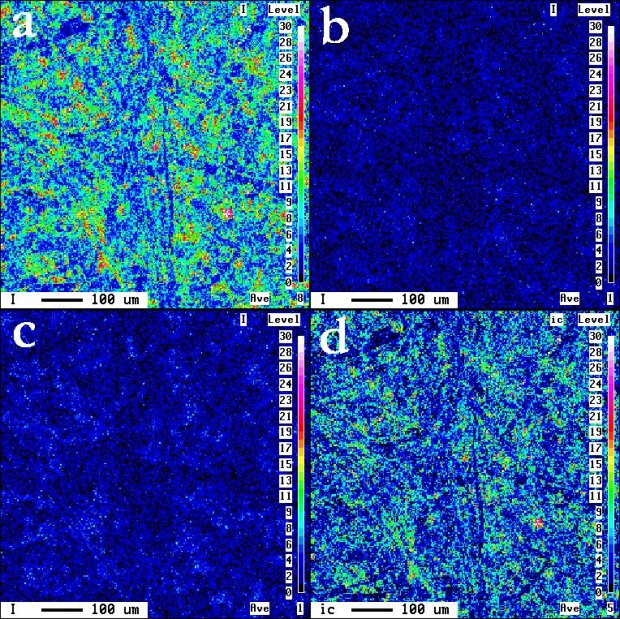
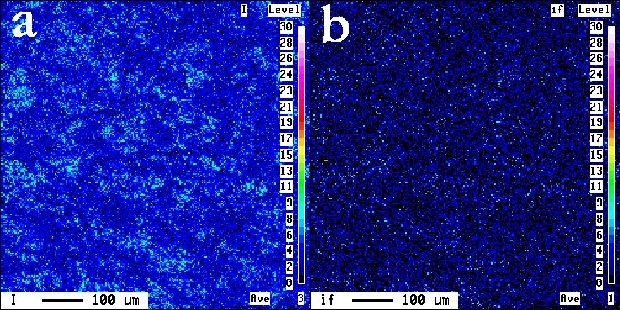
Figure 6 Iodine map of unstained sample C9 (i.e.
no iodine). a) raw iodine image. b) background
corrected image. Figure 5d shows a background corrected
map for the same paper treated with iodine.
![]()