The great success in ink-jet printer sales in recent years is due in part to their low prices, resolution comparable to laser printers and their ability to print on plain paper using water soluble inks. The last item presents a challenge when high print quality is desired. For the best print quality, the paper must have appropriate wetting (degree of ink penetration and spreading ) characteristics. The frictional characteristics of the paper surface are also important in ensuring reliable sheet feeding.
For these reasons, paper surfaces must be modified. Most commonly, the paper surfaces are modified by the application of starch, synthetic polymers, pigments or coatings. In this study we will deal primarily with papers treated starch and starch-polymer mixtures (This process is known as sizing). The type and amount of fillers in the paper are also important. The most commonly used filler is pcc (precipitated calcium carbonate) with SiO2, TiO2 and clays used to a lesser extent.
In order to better understand the importance of varying the sizing parameters (i.e. type of starch, type and amount of sizing polymers, viscosity of starch-polymer mixture etc.) and filler parameters (i.e. amount of pcc used), the spatial and size distribution of starch and pcc both on the surface and within the paper must be determined. These distributions of starch play an important role in the wettability of the paper. The same information for the pcc is also crucial because the surface coverage with respect to pcc affects the roughness of the paper surface. Further, the spreading, penetration and distribution of starch-sizing polymer mixture are also affected by the presence of pcc. With this type information we can make a quantitative assessment of the factors which affect print quality in ink jet papers. Although there are techniques available for determining the bulk concentration of sizing and fillers, techniques for determining their spatial distributions have not been widely used.
One technique which allows simultaneous determination of the distribution of starch - polymer mixes and pcc is X-ray mapping using Wavelength Dispersive Spectroscopy (WDS). This method is rapid, requires minimal preparation, and presents graphical results which may be processed using standard image analysis techniques.
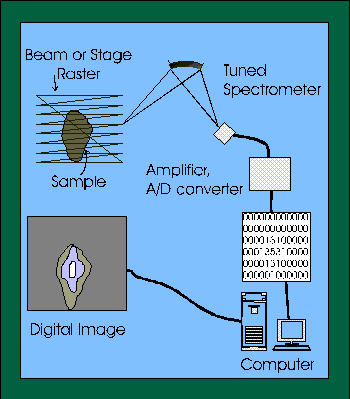
The basis of this technique (Figure 1) is to scan the sample either by scanning the beam or by shifting the stage under the beam and to meauring the characteristic X-rays as the beam interacts with the sample. The X-ray intensities are then plotted as a grey scale with lighter colours corresponding the higher X-ray intensity. Although modern EDS analyzers are capable of digital mapping, WDS has several advantages:
- Higher count rates and therefore better detection limits (Up to an order of magnitude better1.
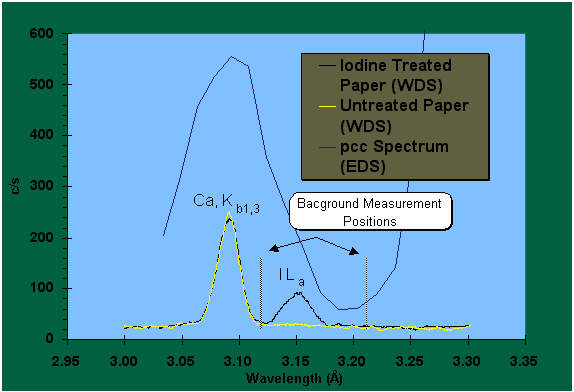
- Resolution up to an order of magnitude better than EDS1 (Figure 2 )

Figure 1. Schematic showing basic process of WDS X-ray
mapping.
Figure 2. Spectra showing
the position of the I L line with respect to the Ca K 1,3 line.
Note higher resolution of WDS spectra. Counts are not to scale
for EDS spectrum

![]()