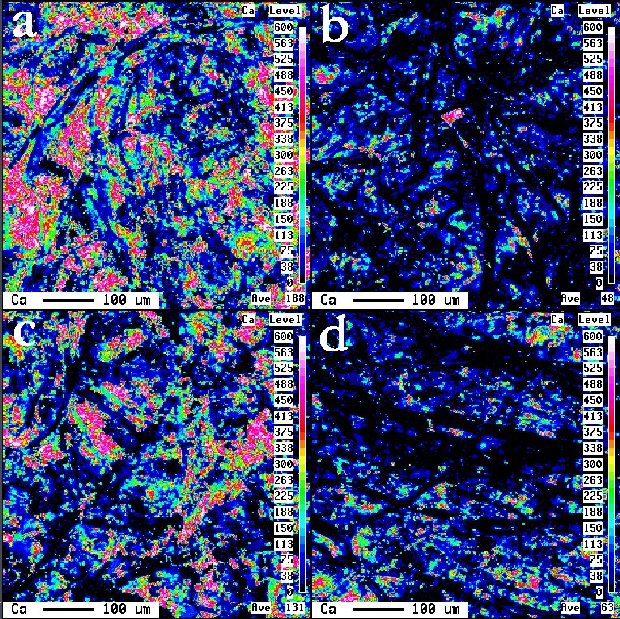
Figure 8 shows the results of calcium mapping on both sides of two representative sheets of ink jet paper with differing print qualities. The most obvious feature is the difference between the coverage on the wire (lower) side and the felt (upper) side, which is a characteristic of the type of machine used to make this paper. Four separate areas for each of these papers were mapped and compared with respect to pcc coverage. A plot of coverage versus greylevel threshold (Figure 9) shows that the two papers are very different in their Ca (=pcc) distributions with respect to each side and to each other. From this figure it is obvious that the homogeneity of each side is variable, one paper exhibiting homogeneous distributions, and the other variable distributions. This difference in coverage between the sides and the relative homogeneity of coverage on each side (see Figure 9b) tends to exacerbate the papers two-sidedness, a quality which is undesirable in premium papers.
Figure 8
Calcium mapping. a) and b) felt and wire side respectively
of sample C3. c) and d) felt and wire side respectively of sample
C9.
Figure 9 Percent pcc (= Ca) coverage versus grey level thresholds for samples C3 a) and C9 b) Data is for four maps on each side of each sample. c) Comparison of pcc ( = Ca) coverage for wire and felt sides of samples C3 and C9. Data is for four maps on each side of each sample.
![]()